
Table of Contents
Creating daily KPI reports for digital marketing is essential for tracking the effectiveness of your strategies, analysing campaign performance, and achieving your business goals. These reports help digital marketers monitor key performance indicators and assess the success of marketing activities such as social media campaigns, email marketing, and paid ads. By focussing on the right KPIs, you can make data-driven decisions to optimise your efforts and improve overall business performance.
In this guide, we’ll walk you through the steps of building effective daily reports, identifying the most important metrics, and utilising the best practices to ensure your digital marketing strategy aligns with your business objectives. Whether you’re a marketing manager, business owner, or part of a marketing agency, understanding how to create and analyse daily KPI reports will empower you to gain actionable insights and make better decisions for long-term success.
Understanding Daily KPI Reports and Their Importance
What Are Key Performance Indicators in Digital Marketing?
Key performance indicators (KPIs) in digital marketing are measurable metrics that help evaluate the success of your marketing activities. They provide insights into how well your strategies are performing and allow you to align your efforts with your business goals. KPIs can vary depending on the focus of your digital marketing campaigns, but common examples include bounce rate, click-through rate, website traffic, and customer acquisition cost. By tracking these metrics, you can identify trends, measure the effectiveness of advertising campaigns, and optimise your overall digital marketing strategy.
For digital marketers, understanding KPIs is critical to making data-driven decisions. They serve as a starting point for assessing campaign performance and determining whether specific goals are being met. For instance, if your objective is lead generation, tracking new leads and engagement rate is essential. Similarly, if your focus is on increasing organic traffic, monitoring keyword rankings and organic search metrics will provide clarity on whether your efforts are paying off.
How Daily Reports Align with Business Goals
Daily KPI reports play a vital role in aligning your marketing efforts with your business goals. By monitoring essential metrics daily, you can ensure that your strategies are on track and quickly address any discrepancies. These reports provide a clear picture of your current performance, enabling you to adjust your digital marketing activities in real-time. Whether your goal is to acquire new customers, improve customer satisfaction, or increase total revenue, daily reporting keeps you focussed on achieving these objectives.
For example, if your business aims to boost the number of paying customers through paid ads, tracking ad spend and click-through rates daily can help you optimise your campaigns for better results. Similarly, monitoring social media KPIs such as engagement rate and social media followers can help you understand whether your social media marketing efforts are resonating with your target audience. This consistent tracking ensures that your marketing spend is being utilised effectively to achieve strategic goals.
Key Metrics to Track in Digital Marketing KPI Reports
Tracking Social Media KPIs and Engagement Rate
Social media KPIs are crucial for understanding how your audience interacts with your content across different social media channels. Metrics like engagement rate, which measures likes, shares, comments, and other interactions, provide valuable insights into the effectiveness of your social media campaigns. These metrics not only show how well your content is performing but also highlight opportunities to better connect with your target audience.
In addition to engagement rate, tracking social media followers and the number of people reached by your posts can help measure the growth and visibility of your brand. Platforms like Facebook Insights offer detailed analytics to evaluate your performance on specific social media platforms, enabling you to refine your strategy. Regularly monitoring these metrics ensures your social media marketing aligns with your broader digital marketing strategy.
Monitoring Bounce Rate, Click-Through Rate, and Ad Spend
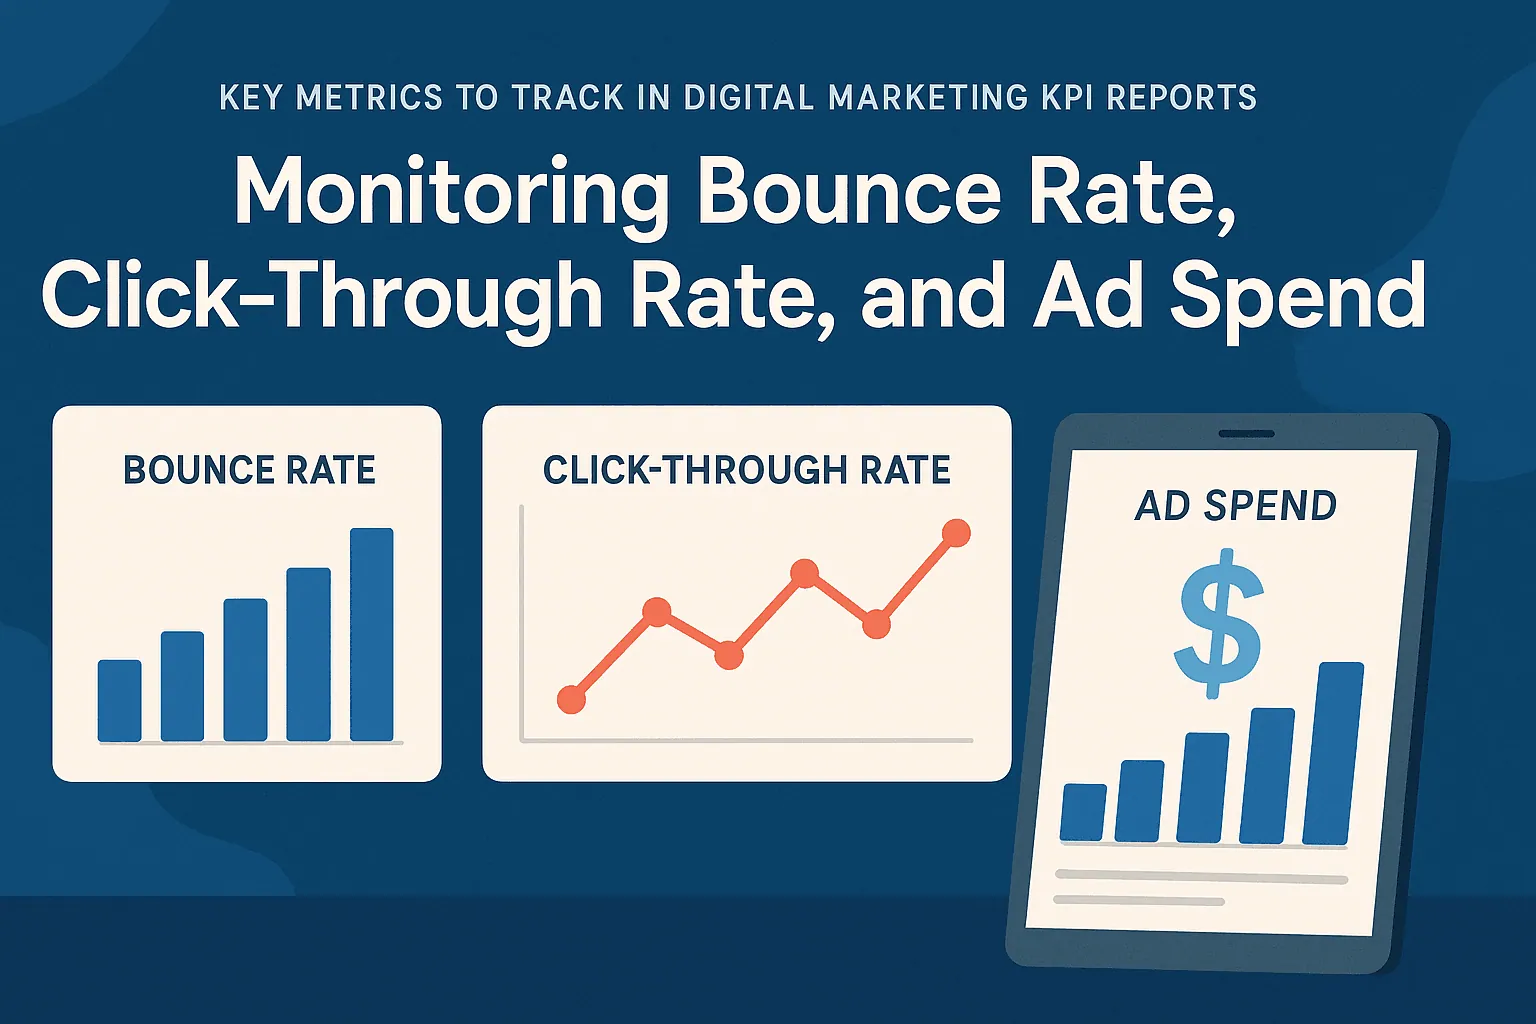
Bounce rate, click-through rate, and ad spend are essential metrics for evaluating the performance of your website and advertising campaigns. A high bounce rate may indicate poor user experience or irrelevant content, signaling the need for improvements in your website or landing pages. Similarly, click-through rate measures the effectiveness of your ad campaigns by calculating the percentage of users who click on your ads. This metric is especially critical for paid ads, including Google Ads and Facebook Ads, as it directly impacts your campaign performance.
Ad spend, on the other hand, tracks the budget allocated to your advertising campaigns. By comparing ad spend to other metrics like customer acquisition cost and return on investment, you can determine whether your advertising efforts are cost-effective. Monitoring these key metrics daily helps you identify areas for improvement and ensures that your marketing spend is optimised to achieve the best results.
focussing on Customer Satisfaction and Customer Lifetime Value
Customer satisfaction and customer lifetime value (CLV) are long-term metrics that play a significant role in digital marketing success. Customer satisfaction can be measured through surveys, net promoter score, or feedback from customer interactions. High satisfaction levels often lead to increased loyalty, repeat purchases, and referrals, all of which contribute to the growth of your business.
CLV, on the other hand, calculates the total revenue a customer is expected to generate over their lifetime with your business. This metric helps you understand the profitability of your customer relationships and assess the impact of your marketing activities. By focussing on these metrics in your daily KPI reports, you can align your efforts with the overall customer journey, ensuring that your strategies not only attract new leads but also retain existing customers for long-term success.
Steps to Build a KPI Dashboard for Digital Marketing
Choosing the Right Data Sources and Datasets
The first step in building a KPI dashboard for digital marketing is selecting the right data sources and datasets. Your data sources should provide accurate and actionable insights into your key metrics. For example, tools like Google Analytics, Google Search Console, and Facebook Insights are excellent for tracking website traffic, keyword rankings, and social media performance. These platforms offer reliable datasets that cover a wide range of metrics, from page views to bounce rates and engagement rates.
When choosing your data sources, consider your digital marketing strategy and specific goals. If your campaigns focus on lead generation, you’ll want to track metrics like new leads and customer acquisition cost. Similarly, if your goal is to increase organic traffic, prioritise datasets related to organic search, website visits, and unique visitors. Ensuring that your data sources align with your marketing objectives will help you create a more effective reporting dashboard.
Setting Up Your Dashboard Template in Google Sheets
Google Sheets is one of the best tools for creating a customizable and shareable KPI dashboard. To set up your dashboard template, start by identifying the most important metrics you need to track. These might include digital marketing KPIs such as click-through rate, customer lifetime value, and campaign performance. Create separate sections or tabs for different categories of metrics, such as social media channels, website analytics, and paid ads.
Once you’ve outlined your metrics, use Google Sheets’ built-in features to automate data collection and visualisation. For instance, you can use formulas to calculate metrics like engagement rate or customer acquisition cost and create charts to visualise trends over time. By setting up a dynamic dashboard template, you’ll save time on manual updates and ensure that your daily KPI reports are always up to date. Additionally, you can integrate tools like Google Data Studio for more advanced data visualisation and reporting capabilities.
Incorporating Google Search Console and Facebook Insights
Google Search Console and Facebook Insights are essential tools for any digital marketer looking to build an effective KPI dashboard. Google Search Console provides valuable data on your website’s organic search performance, including keyword rankings, click-through rates, and impressions. By integrating this data into your dashboard, you can monitor how well your SEO efforts are contributing to overall website traffic and lead generation.
Similarly, Facebook Insights offers a wealth of information about your social media marketing activities. You can track metrics such as engagement rate, post reach, and the number of people interacting with your content. This data is crucial for evaluating the performance of your social media campaigns and identifying areas for improvement. By combining data from these platforms into a single reporting dashboard, you’ll have a comprehensive view of your digital marketing performance.
analysing Data for Actionable Insights
analysing the data collected in your KPI dashboard is crucial for extracting actionable insights that can drive your digital marketing strategy forward. This process involves identifying trends, measuring the success of your campaigns, and making informed decisions to improve your business performance.
Unique Visitors, Website Traffic, and Organic Search
Tracking unique visitors and overall website traffic provides a clear picture of how well your digital marketing campaigns are attracting potential customers. These metrics help you measure the effectiveness of your content, ad campaigns, and SEO efforts. Organic search, in particular, is a key indicator of your website’s visibility and relevance. Monitoring keyword rankings and organic traffic can help you identify which search engine optimization strategies are working and where adjustments are needed.
Paid Ads, New Leads, and Keyword Rankings
Paid ads, such as Google Ads and Facebook Ads, are a significant part of many digital marketing campaigns. To evaluate the success of your ad campaigns, track metrics like click-through rate, ad spend, and customer acquisition cost. These metrics reveal whether your advertising campaigns are delivering value and attracting new leads effectively. Additionally, keeping an eye on keyword rankings can help you optimise your ad targeting and content strategy to drive better results.
Social Media Followers and Website Visits
Social media followers and website visits are valuable indicators of your brand’s reach and engagement with your audience. analysing the growth of your social media channels and the traffic they drive to your website can provide insights into your audience’s preferences and behaviours. These metrics also help you measure the impact of your social media campaigns and identify opportunities to improve user experience and engagement across platforms.
By regularly analysing these metrics, you can uncover actionable insights that guide your next steps in optimising your digital marketing activities. Whether it’s refining your paid ads strategy, improving your website’s performance, or enhancing your social media presence, data-driven decisions ensure that your efforts align with your specific goals and deliver measurable results.
Using Marketing Report Templates for Monthly Reports
customising Reports for Specific Goals and Time Periods
Marketing report templates are valuable tools for creating consistent and effective monthly reports. These templates simplify the process of organising data and presenting it in a format that aligns with your specific goals and time periods. Whether you’re tracking the success of digital marketing campaigns, measuring ROI, or analysing traffic sources, a well-designed template ensures that all essential metrics are accounted for.
To customise your report, begin by identifying the most important KPIs for the specific goals of your campaign. For example, if your goal is lead generation, include metrics like new leads, click-through rate, and website visits. If you’re focussed on increasing customer lifetime value, highlight metrics like customer satisfaction, net promoter score, and paying customers. Additionally, adjust the time period of the report to reflect the duration of your campaigns or specific intervals, such as monthly, quarterly, or annually. A customised marketing report template enables better decisions by providing actionable insights tailored to your objectives.
Examples of KPIs for Digital Marketing Campaigns
When creating monthly reports for digital marketing campaigns, selecting the right KPIs is crucial to accurately measure performance. Here are some examples of KPIs commonly used across various marketing activities:
-
Website Performance: Metrics like page views, bounce rate, and unique visitors provide insights into the effectiveness of your website in attracting and retaining users.
-
Social Media KPIs: Engagement rate, social media followers, and the number of people reached through social media platforms are key metrics for evaluating the success of your social media campaigns.
-
Advertising Campaigns: For paid ads, track ad spend, click-through rate, and customer acquisition cost to measure the efficiency and impact of your advertising efforts.
-
Lead Generation and Sales: Metrics such as new leads, paying customers, and customer lifetime value help assess the success of your lead generation and sales activities.
-
SEO and Content Marketing: Organic traffic, keyword rankings, and blog posts performance provide insights into the effectiveness of your search engine optimization and content marketing strategies.
Including these KPIs in your digital marketing report template ensures a comprehensive view of your campaign performance, helping you identify strengths, weaknesses, and opportunities for improvement.
Best Practices for Digital Marketing Reporting
Aligning KPIs with Strategic Goals and Business Performance
To create effective digital marketing reports, it’s essential to align your KPIs with your strategic goals and overall business performance. Start by defining your business objectives, such as increasing total revenue, enhancing customer satisfaction, or acquiring new customers. Then, select the most important KPIs that directly relate to these objectives. For instance, if your goal is to increase website traffic, focus on metrics like page views, unique visitors, and traffic sources.
Regularly reviewing and updating your KPIs ensures that they remain relevant to your evolving business goals. This alignment not only helps you measure the impact of your marketing efforts but also provides a clear roadmap for achieving long-term success. By focussing on essential metrics that drive business performance, you can ensure that your reports deliver meaningful insights to both your team and stakeholders.
Tracking New Customers, Paying Customers, and Free Trial Conversions
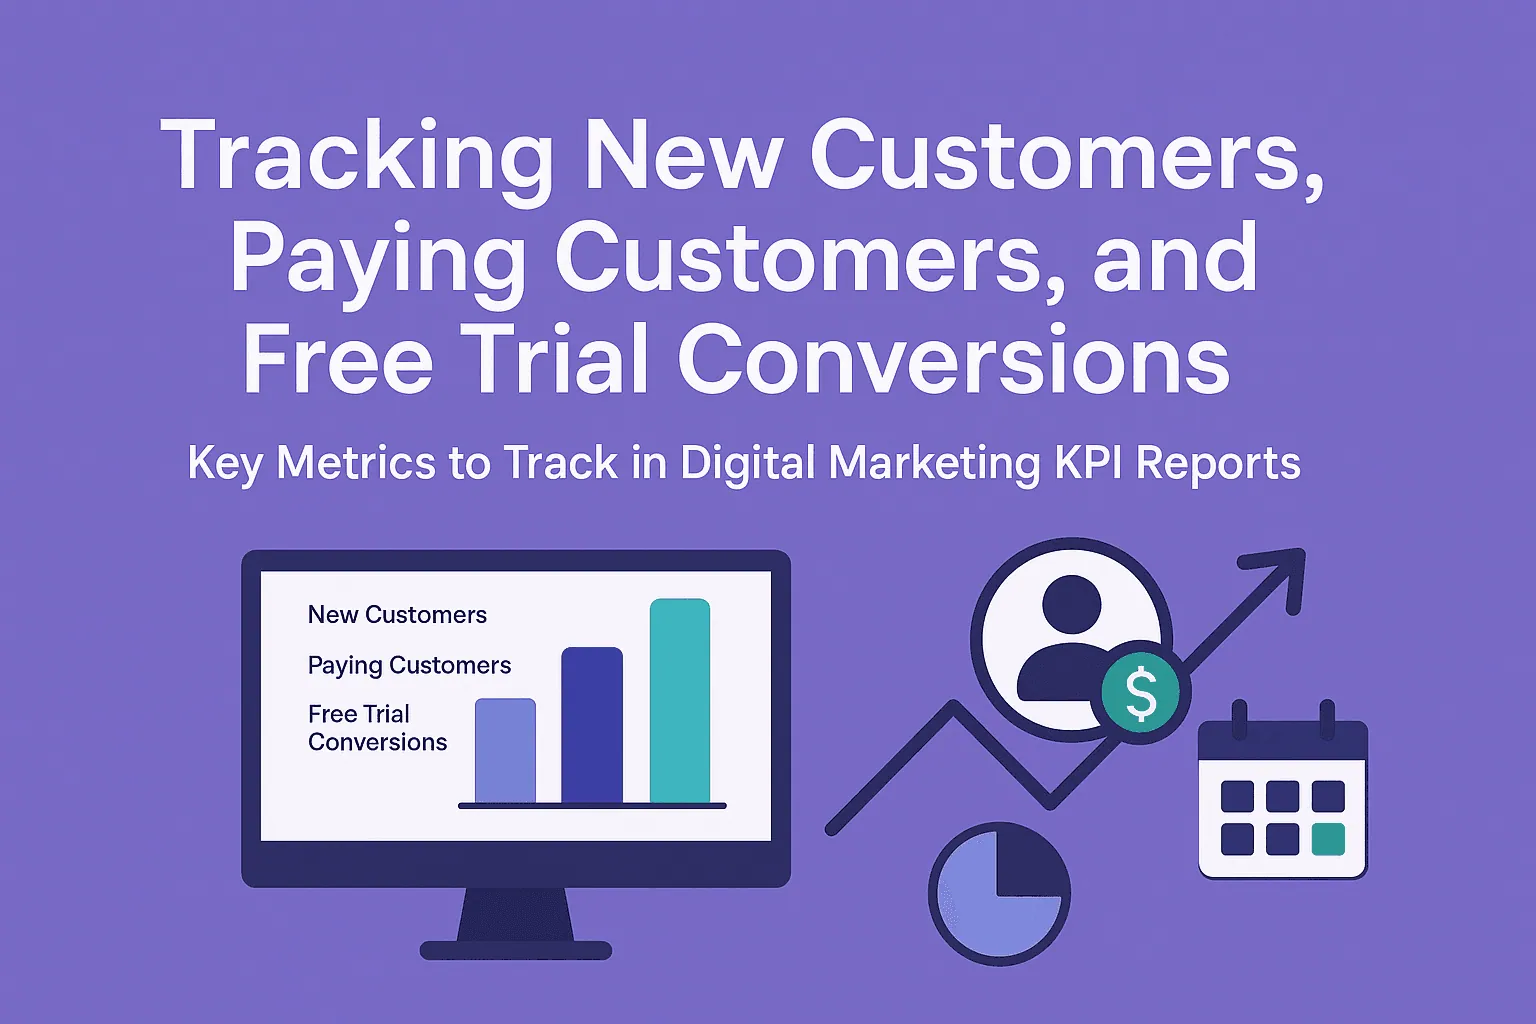
One of the best ways to evaluate the success of your digital marketing activities is by tracking metrics related to customer acquisition and conversions. Metrics like new customers, paying customers, and free trial conversions provide a direct measure of how well your campaigns are driving growth. For example, if you’re running email campaigns to promote a free trial, monitoring the conversion rate from free trial to paying customers can help you assess the effectiveness of your email marketing strategy.
In addition, tracking customer acquisition cost allows you to measure the efficiency of your marketing spend. By comparing this cost to the revenue generated from new customers, you can determine the profitability of your campaigns. Including these metrics in your reports ensures a clear understanding of how your digital marketing efforts contribute to your company’s bottom line.
Leveraging Data visualisation for Better Decisions
Data visualisation is a powerful tool for making your digital marketing reports more accessible and actionable. Visual elements like charts, graphs, and dashboards help simplify complex datasets and highlight key trends and patterns. For example, a line graph showing changes in keyword rankings over time can quickly reveal the impact of your SEO efforts, while a bar chart comparing engagement rates across social media channels can identify the platforms driving the most engagement.
Using tools like Google Sheets, Google Data Studio, or other reporting platforms, you can create visually engaging dashboards that present your KPIs in an easy-to-understand format. This not only saves time for marketing managers and team members but also ensures that your reports provide actionable insights to business owners and stakeholders. Effective data visualisation is a critical component of digital marketing reporting, enabling you to make informed, data-driven decisions that improve campaign performance.
How to Ensure Consistency in Daily KPI Reporting
Collaborating with Team Members and Sales Team

Consistency in daily KPI reporting starts with effective collaboration among team members and the sales team. By ensuring that everyone involved in the reporting process understands the key performance indicators being tracked, you can create a unified approach to data collection and analysis. Regular communication between digital marketers, marketing managers, and the sales team helps align reporting efforts with overarching business goals, ensuring that the metrics being tracked are relevant and actionable.
To improve collaboration, schedule regular check-ins or meetings to review the KPI dashboard and discuss findings from the daily reports. This provides an opportunity to address any discrepancies, share actionable insights, and refine your strategies as needed. For example, if the sales team notices a dip in new customers, they can work with digital marketers to adjust advertising campaigns or email marketing efforts to improve lead generation. Consistent teamwork ensures that everyone is on the same page, ultimately leading to better decisions and improved campaign performance.
Using Marketing Tools to Automate KPI Reporting
Leveraging marketing tools to automate the process of KPI reporting is one of the best ways to maintain consistency. Automation not only reduces the time and effort required to compile daily reports but also minimises the risk of human error in data collection. Tools like Google Sheets, Google Data Studio, and specialised marketing software can pull data from multiple sources such as Google Analytics, Facebook Insights, and Google Search Console, streamlining the entire reporting process.
These tools also offer features like data visualisation and pre-built dashboard templates, which make it easier to track key metrics like bounce rate, click-through rate, and ad spend in real time. For example, marketing tools can automate the tracking of website visits, keyword rankings, and social media followers, ensuring that your daily reports are always up to date. Automation allows marketing managers and team members to focus on analysing data and implementing strategies, rather than spending hours manually compiling reports. This ensures a more efficient and consistent approach to daily KPI reporting.
Key Takeaways for Creating Effective Daily KPI Reports
Daily KPI reports are essential for making data-driven decisions and improving digital marketing activities. By focussing on the most important metrics, such as website traffic, customer satisfaction, and engagement rate, you can ensure your strategies align with your business goals and deliver measurable results. Regularly analysing these metrics helps digital marketers identify trends, optimise campaigns, and make informed adjustments to achieve better performance.
Consistency and collaboration are key to successful KPI reporting. By using marketing tools to automate data collection and visualisation, and working closely with team members and the sales team, you can create reports that provide actionable insights every day. This approach not only saves time but also empowers you to track campaign performance effectively and achieve your strategic goals.